
Fix
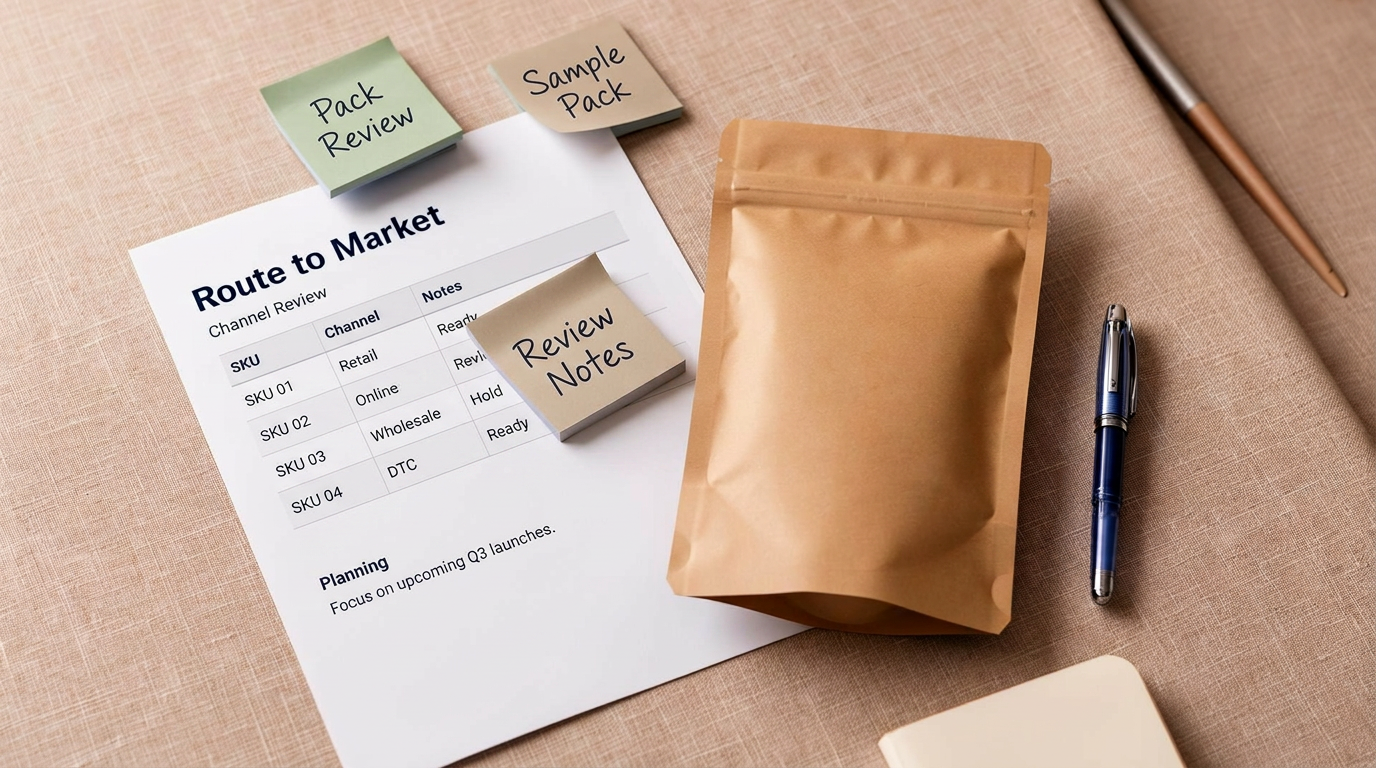
A health brand losing shelf space in grocery
Strong story, but pack hierarchy, pricing and range structure are making it hard for buyers and customers to read.
ProductCue helps consumer product businesses understand what their product is really saying to the market, then align it so it performs.
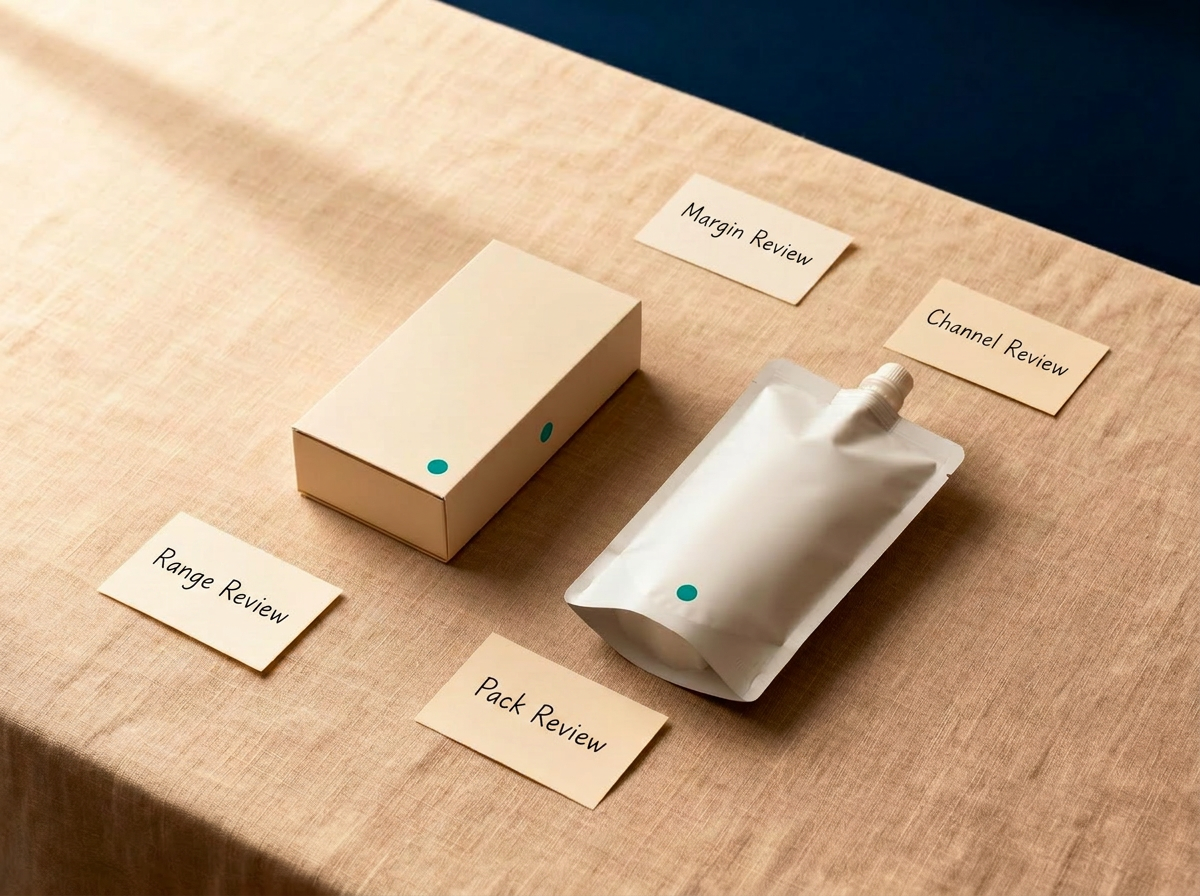
Most ranges leak in three ways at once: meaning, margin and momentum.
We read those three signals together, and rewire them so the product performs.
Pack design, range, price and channel requirements are communicating different things. Buyers and customers cannot read the product clearly.
Margin is leaking through the wrong pack format, the wrong supply route or the wrong price ladder, not through demand.
The product is good. The story is good. But shelf, online and channel mechanics aren't set up for it to perform.
A short, guided first read of your product, pack, price and route to market, before any paid work is discussed.
You share the key product information first.
ProductCue reviews the early signals.
A forty five minute Product Signal call follows.
ProductCue identifies the best next step and, where appropriate, discusses how we can help your business.
The complimentary first step. You share the key product information, ProductCue reads the early signals, then a forty five minute Product Signal call follows to understand the challenge and judge fit.
The paid diagnostic and recommendation stage, only proposed once there is a clear fit and valid reason to continue.
Focused work only when the review has shown what is actually holding the product back, or where it is genuinely ready to scale.
Continued senior product and commercial judgement, only where it is the right route for the business.
A paid senior commercial read of your product, packaging, range, price, margin, supply route and route to market. The ProductCue Review is normally discussed after the Product Signal Preview, when there is a clear fit and valid reason to continue.
Tightening pack, range structure and cost-to-serve so the product is ready for retail, online or buyer pitch.
Hands-on support for shelf, online presence, channel mix and route-to-market decisions.
Ongoing senior product and commercial judgement alongside your team, without a full-time hire.
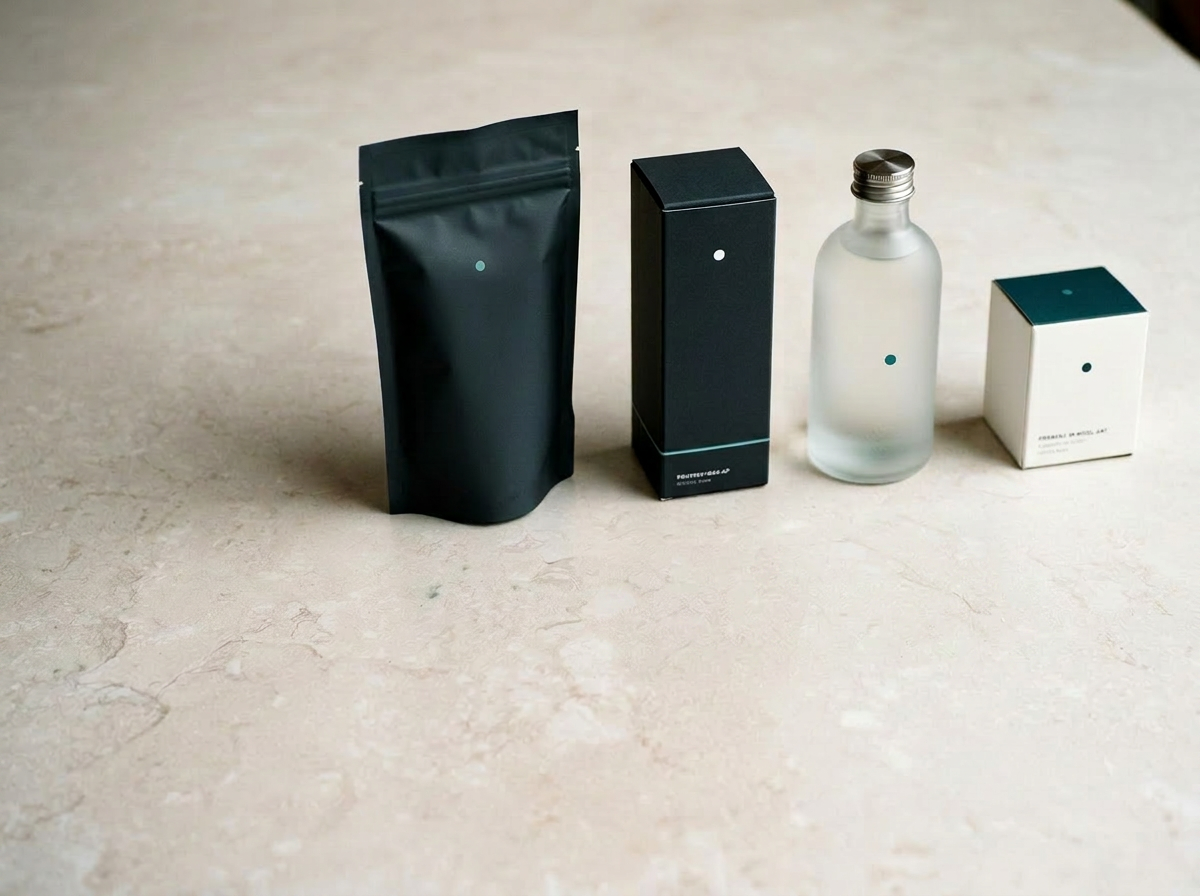
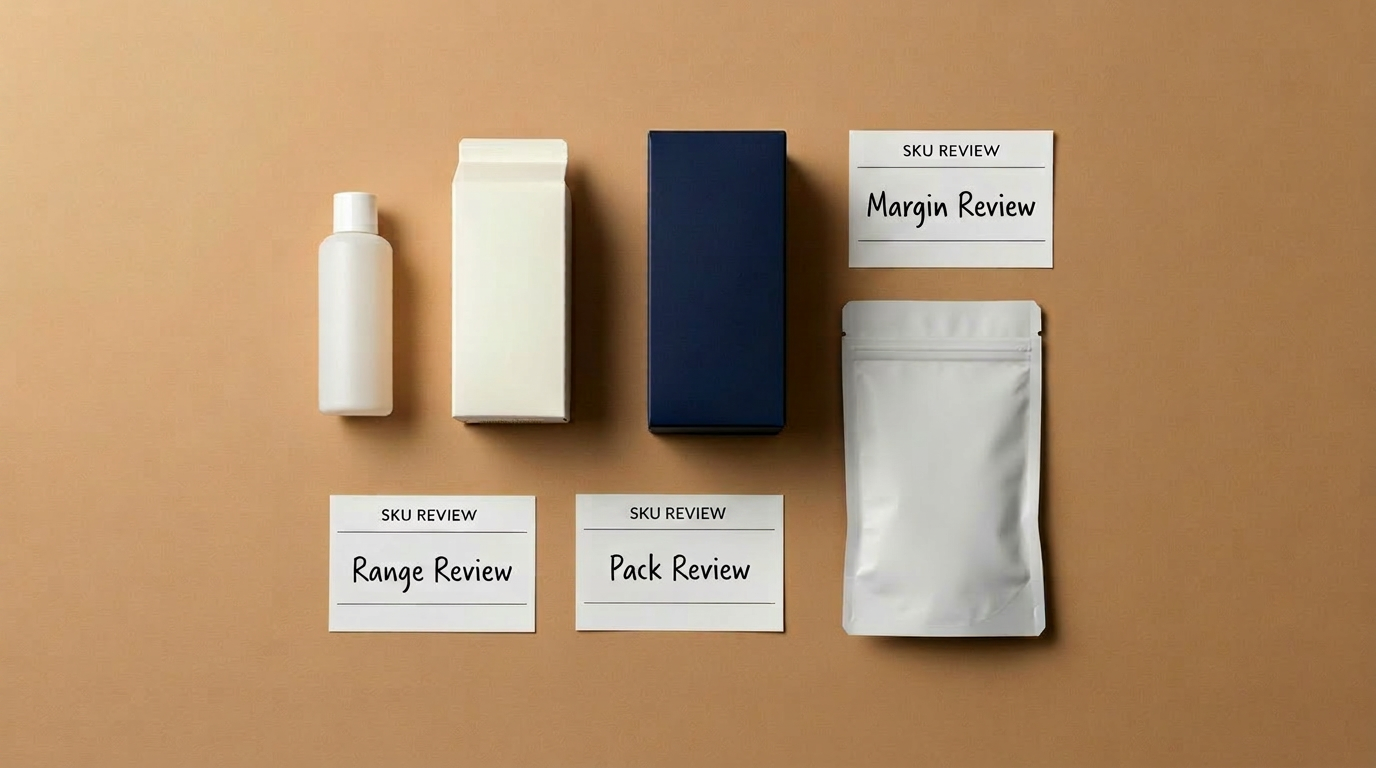
Read what the product is saying today.
Sharpen what the product actually is.
Make the pack do the commercial work.
Build a ladder that holds up.
Cost-to-serve that doesn’t leak.
Retail, online and buyer-ready.
Track what the change does.
This is a selection of the brands, retailers and commercial channels associated with the products and projects we have worked on. Our experience extends across many more consumer product businesses, categories and routes to market.


Logos shown represent previous experience across client projects, retailer channels and brand work.
“On shelf, online and in a buyer’s hand, the product is the argument.”
Illustrative situations, not case studies, to give a feel for the shape of work we take on.
Strong story, but pack hierarchy, pricing and range structure are making it hard for buyers and customers to read.
Online traction is real, pack, price ladder and unit economics now have to work for retail.
Loved by early customers; the next stage needs clearer positioning, stronger packaging and a sharper commercial route for the team taking it forward.
ProductCue is built on more than 30 years of hands on experience developing products, packaging and commercial routes for consumer brands. The work sits across product development, packaging formats, manufacturing, supply chains, retail readiness, pricing, margin, buyer presentation and route to market.
The team has experience not only advising on products, but also building product led businesses from the ground up, taking ideas through development, production, channel preparation and commercial launch. That is why ProductCue is practical, direct and commercially grounded, closer to senior product and commercial judgement than a consultancy deck.
Start with a Product Signal Preview. Share the key details, let ProductCue read the early signals, then we will talk through whether there is a clear fit and valid reason to continue.